Here’e the diagram…..
What’s the question?
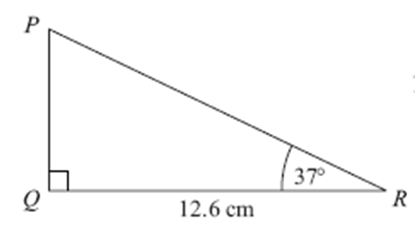
Seeing this well received resource, GCSE Question Prompts on TES recently reminded me that I have successfully used this idea myself before. For example for GCSE revision I have given students a selection of various triangle diagrams and asked them what the question might have been. This proved to be a useful way of revising several topics – some of which students sometimes mix up! For several of these triangles there are many possibilities and students can be asked which lengths and / or angles they could work out.
Further excellent examples come from Mark Greenaway – GCSE Visual Prompts for both Higher and Foundation. Mark’s resources show the diagram first and then also include the complete question.
This idea could be used for a starter on just about any topic – provide students with an image or perhaps just an expression and ask them to write a question to go with the image.
 See also Diagrams in Mathematics.
On the subject of diagrams I really like Tom Sherrington’s post “Empowing students to own their learning solves maths problems“; a great idea to start with a diagram with no labels at all as a way into a problem.

MEI have an excellent free collection of GCSE starters. Designed for the start of a GCSE lesson, the diagrams and questions are very clear and will display well on the IWB. There are several starters under the following headings: Mathematical Reasoning, Number, Algebra, Geometry and Measures and Statistics and Probability. Files with the answers and teachers notes are also provided. Many of the diagrams here could be used for students to write their own questions. It is not always possible to have the IWB up and running, particularly if you are coming from a different room and I do like to get students working straight away. Experimenting, I found that I could tale a screenshot (I do like the snipping tool in Windows 7) and fit eight to a page! I used a Word document with very small top and bottom margins and a two column layout.
Staying with MEI, Bernard Murphy has some great ideas here on using pictures in A Level trigonometry. Look at this diagram – all the trigonometric ratios!
How creative can you be? I wonder what they would make of something like this…

Visualisation from Data Pointed
For further visualizations see this collection.
Perhaps a photo from the Bad Maths collection on flickr

cc licensed ( BY ND ) flickr photo shared by Danny Nicholson
Click here for the complete collection.
or a holiday snap!

